Your tool for analyzing and illustrating simulation results
GBU-Gantt
Easily recognize relations and interdependencies
GBU-Gantt clearly displays the interplay of your processes and thus supports you in the process improvement.
- Track orders and their usage of resources.
- At GBU-Gantt each resource (staff, room, equipment) is assigned a row. On these resource rows the operations carried out are chronologically shown.
- In addition, the associated resource states (working, setup, waiting, blocked, down) can also be displayed.
- Tailored to varying questions you can scale the time axis and select relevant resources.

Process Simulator Evaluation
GBU Live eSeminar
Process Simulator Tutorials
GBU-Gantt
Read the results intuitively
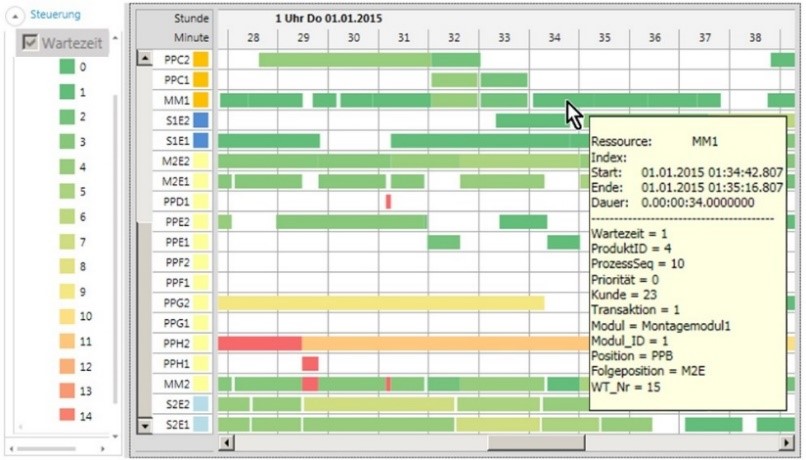
- User-specific attributes (such as waiting time, produtID, ProcessSeq, priority, customer, …) are displayed for each process.
- Expand the attribute list to your needs with little effort.
- Based on the attribute values, you can color all processes. At a glance, you will find, for example, long waiting times or recognize orders with high priority.
- So you can identify dynamic bottlenecks and understand the reasons for non-value-added waiting times.
GBU-Gantt
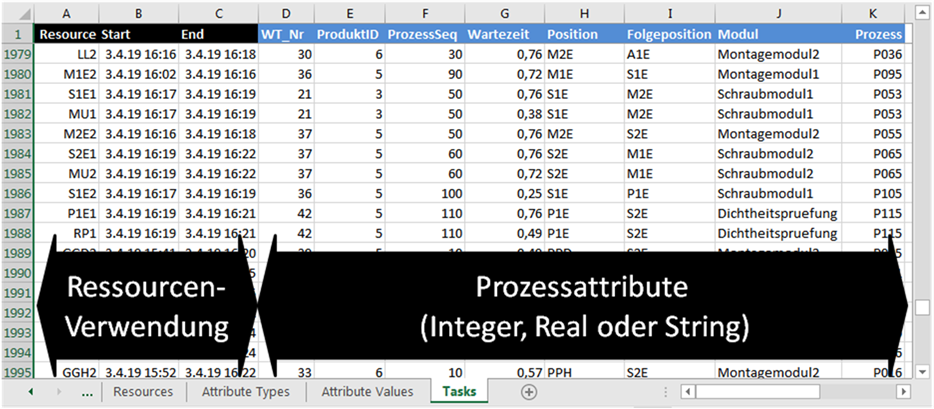
Excel interface opens multifaceted fields of application
- GBU-Gantt can be used very efficiently with the simulation tools Process Simulator and ProModel or MedModel.
- However, process data from other simulation tools (such as Plant Simulation) can also be displayed via the Excel interface.
- Use GBU-Gantt independently of simulation models. Visualize planning data created in Excel or illustrate real production data.

GBU-Gantt
Used with almost every simulation project
- We already use GBU-Gantt during project planning.
- When creating a model, the Gantt evaluation helps to quickly identify model errors.
- The clear presentation facilitates communication with the project participants.
- Dynamic bottlenecks can be quickly identified and analyzed.
- Finally, a Gantt chart illustrates the dynamic processes shown in a presentation.
EasyToUse Template
The quick way to a powerful Gantt evaluation
With the new EasyToUse template, you can extend existing Process Simulator models with a powerful Gantt diagram in just a few steps.
Simply integrate the GBU Gantt template into your existing model via a link.
![[Translate to Englisch:] Binden Sie dazu einfach die GBU-Gantt-Vorlage über einen Link in Ihr bestehendes Modell ein.](/fileadmin/images/gbu_gantt/Abbildung_3.png "Simply integrate the GBU Gantt template into your existing model via a link.")
![[Translate to Englisch:] Nun können Sie bei den Prozessen, die Sie im Gantt analysieren wollen, die Prozesszeit mit GG( ) umschließen. Hierdurch werden Prozessstart und -ende sowie die definierten Attributwerte während der Simulation protokolliert.](/fileadmin/images/gbu_gantt/Abbildung_4.png "Now you can enclose the process time with GG () for the processes you want to analyse in the Gantt diagram. Dur-ing simulation run GG () logs the process start and end, as well as the associated attribute values.")
GBU-Gantt
Analyzing processes in Gantt
Now you can enclose the process time with GG () for the processes you want to analyse in the Gantt diagram.
During simulation run GG () logs the process start and end, as well as the associated attribute values.
Quick results
Evaluate results right after the end of the simulation in GBU-Gantt
At the end of the simulation run you can analyse the resource and employee usage of the processes in the GBU Gantt.
Recognize with the upper status (Legend Top), that due to the concurrent use of the employee "Worker" waiting times arise (yellow upper status for the entities of Type3 at Activity3).
![[Translate to Englisch:] Schon können Sie nach Ende der Simulation die Ressourcen- und Mitarbeiterverwendung der Prozesse im GBU-Gantt analysieren.](/fileadmin/_processed_/f/2/csm_Abbildung_5_ced6dcc7dc.png "At the end of the simulation run you can analyse the resource and employee usage of the processes in the GBU Gantt.")
GBU-Gantt
System requirements
When you install GBU-Gantt, the following system requirements apply:
- Microsoft Windows (32bit & 64bit): Version 10 (from R1607), Version 11
- Microsoft Office (32bit & 64bit): Version 2016, 2019 or 2021 as well as Office 365 with local installation
- Microsoft .NET Framework 4
- 1 GHz or faster 32bit (x86) or 64bit (x86-64) processor
- 8 GB RAM (32bit & 64bit)
- 10 GB available disk space
GBU-Gantt
Everything at a glance
You can find an overview of GBU-Gantt here