


Powerful Features
An in practice proven meta-model supports your efficiency
Creating Models Practically
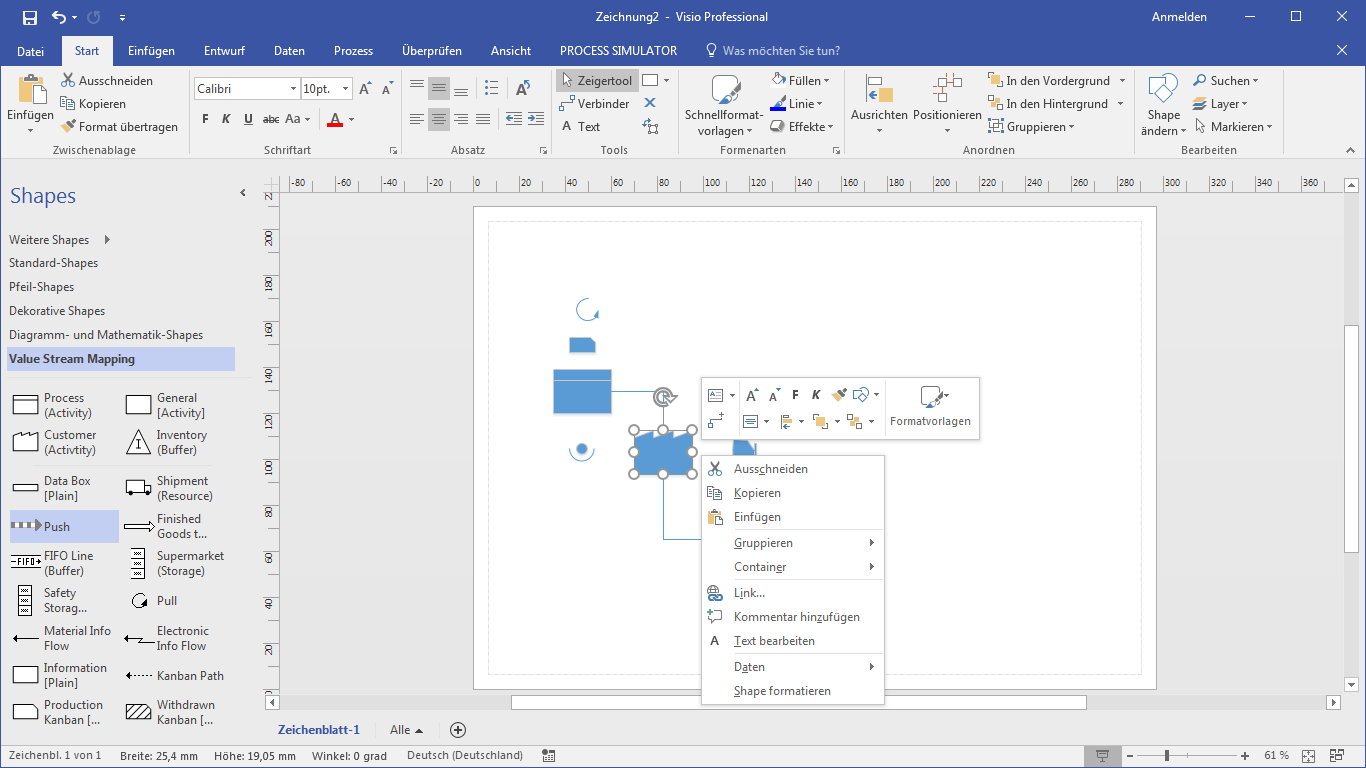
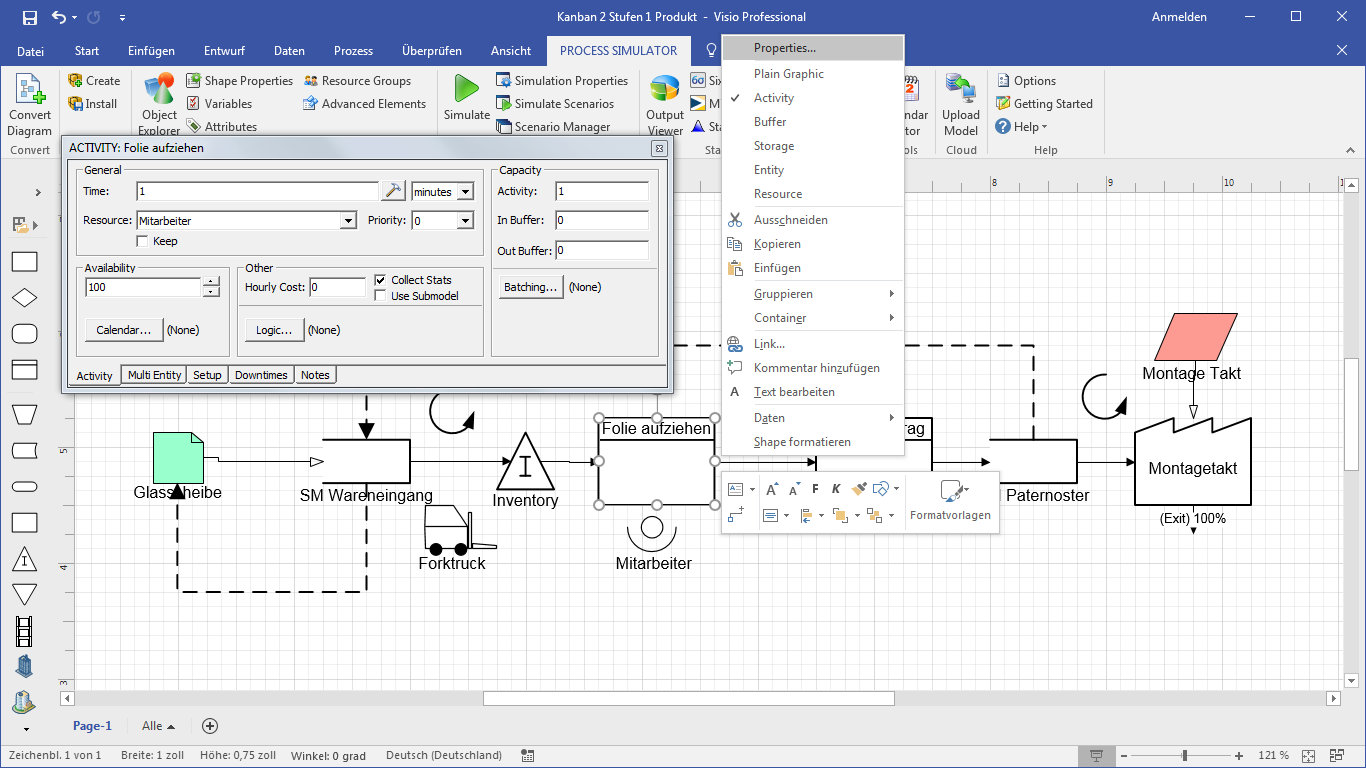
Process Simulator provides a hands-on modeling approach with AREA Meta-Model - Activity, Routing, Entity and Arrival.
With the activities, you model your processes or procedures. The entities are the elements that drive your processes - e.g. the workpiece in production, the pallet in logistics, the patient in health care and the bill in the business process. The routings describe the flow of entities over the activities. You use the arrivals to define the quantity structure to be considered.
In line with the Pareto Principle (80-20 rule), our reference model has the focus on making basic modeling elements quickly selectable and easy to parameterize. Rarer required functions for more specialized tasks can be found in advanced users in the integrated development environment.
You determine the graphical representation of your processes. Model your processes as a value stream, as a swimlane diagram, based on a layout or based on a freely selectable process flow.

Process Simulator Evaluation
GBU Live eSeminar
Process Simulator Tutorials
Seamless integration into the established world of Microsoft Office
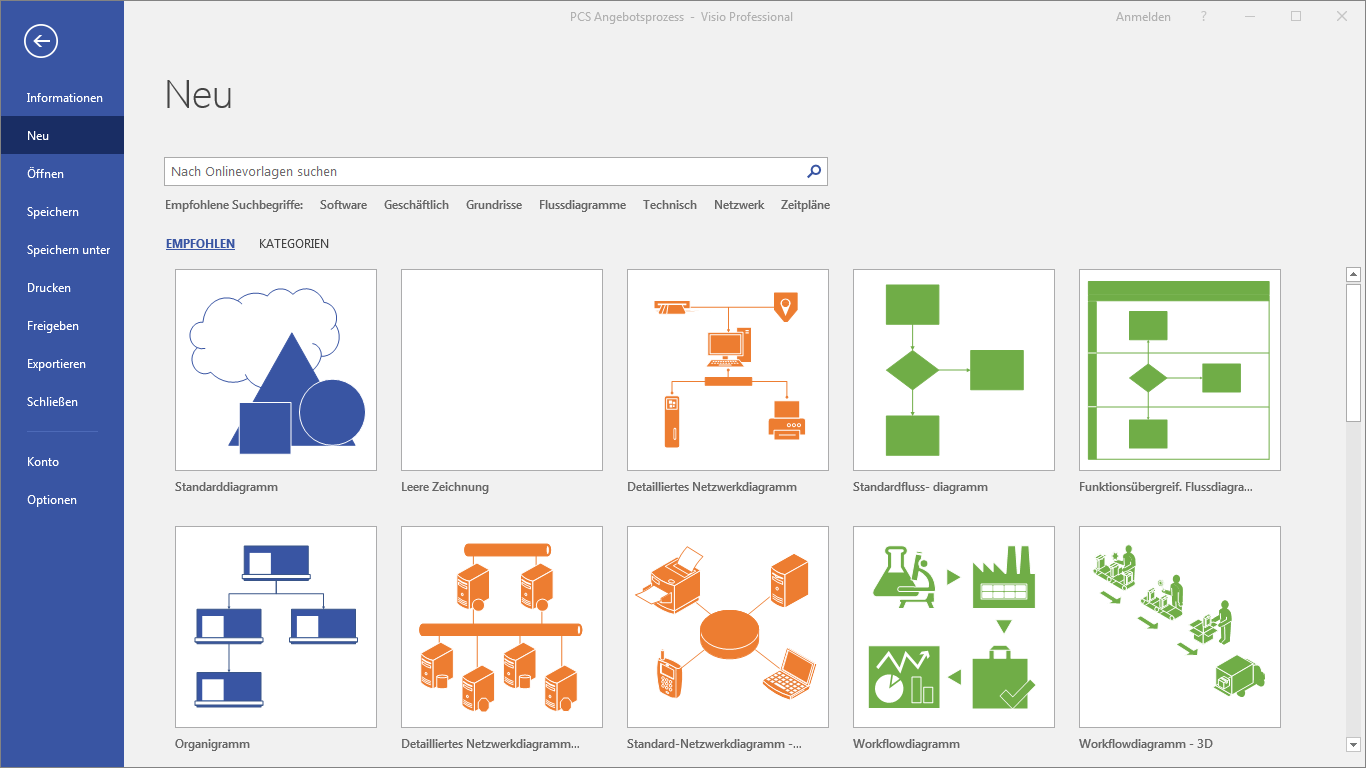
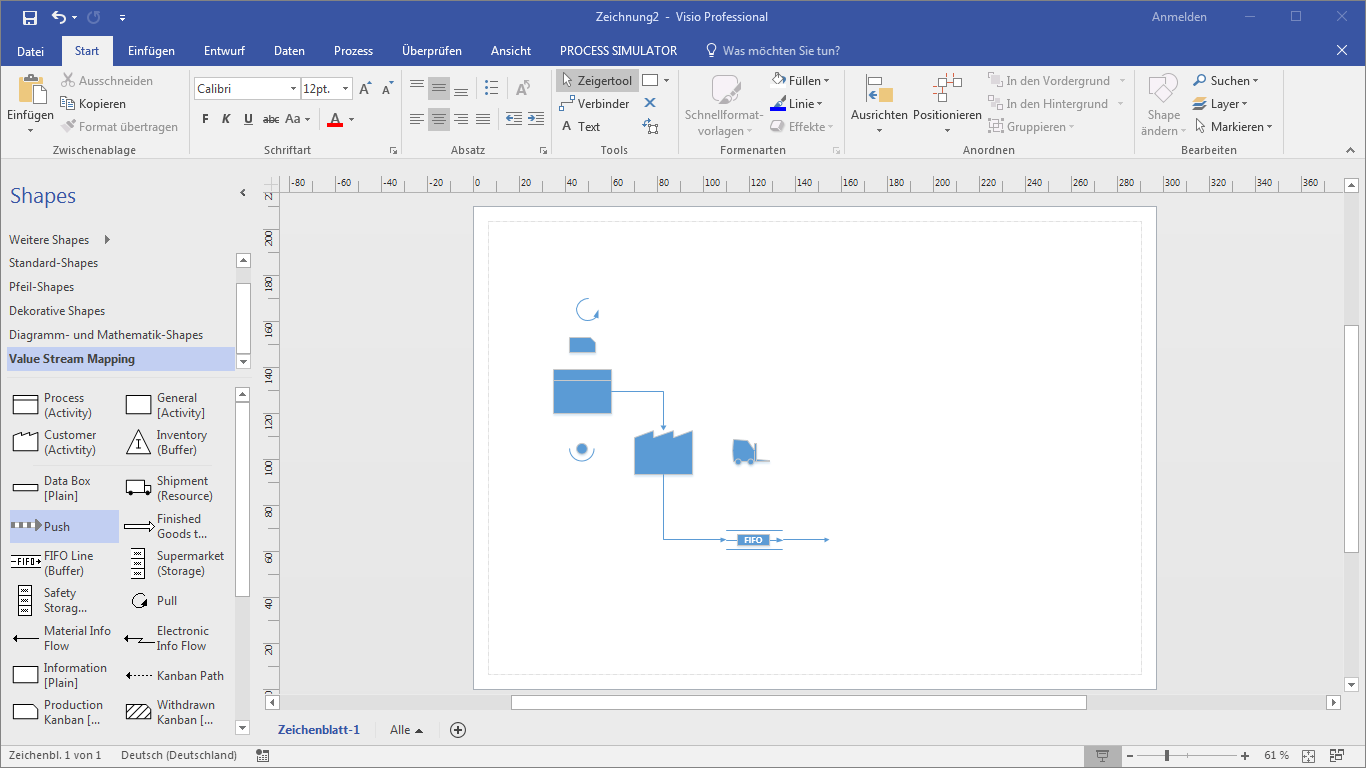
Simulation directly in Microsoft Visio
Use Microsoft Visio to easily and intuitively model your processes, procedures or value streams in the familiar Microsoft Office interface. Process Simulator generates the simulation models for you.
Continue reading
An animation says more than a thousand pictures
Meaningful animations
Based on your process description, moving objects such as workpieces, means of transport, orders or patients are animated directly in the Visio drawing sheet during the simulation. Observe your computer model processes and identify the vulnerabilities. Use animations as a communication tool. Process Simulator becomes a central part of your opportunity management.
You can position your own key figures directly in the Visio worksheet. During the simulation, the current values of the key figures are displayed. Many users create such a simulation cockpit with the key performance indicators (KPIs) for situational assessment of the current process.
Depending on the problem, you can analyze your processes in slow- or fast motion.


Efficiency through syntax highlighting and IntelliSense
Powerful development environment
Most of the processes can be graphically modeled using drag'n'drop and simple parameterization. For more specialized tasks, the Process Simulator also provides a powerful development environment.
Even without much previous knowledge, users can use it text-based, e.g. to program individual key figures or your own controls effectively, you are supported by syntax highlighting and IntelliSense. When writing, context-dependent command explanations as well as suggestions for the selected command sequence are offered.
Syntax highlighting and IntelliSense make it easy to get started with Process Simulator programming, helping you to work efficiently.
Separation of data and model
Interacting with Microsoft Excel
Especially for larger models with many input and output data, the user is supported by the seamless integration with Microsoft Excel.
Master- and transaction data such as routings, process times, fault data or order lists can be imported from Microsoft Excel, during the simulation run, and processed dynamically as arrays during the simulation. Create your customized user interface for your simulation model in Microsoft Excel.
Vice versa, the result data generated during the simulation can be exported back to Microsoft Excel. Of course, it is also possible to export the evaluations created in the OutputViewer as well as the associated raw data to Microsoft Excel.
Even when creating the model, integration with Microsoft Excel can be very useful. You can export all elements of the metamodel and all model parameters in Microsoft Excel worksheets. Especially with large models, this tabular presentation improves the overview. Customize the exported data in Microsoft Excel and then import all changes back to Process Simulator.


Convenient management of numerous simulation experiments
Scenario manager
In simulation studies, simulation runs are usually performed with different parameters, the results compared and finally the optimal configuration selected. For example, it is possible to check without risk how different lot sizes affect the total output.
In the scenario manager, the model parameters that have to be varied can be easily selected and the scenarios that have to be simulated can be defined in a table. The simulation experiments defined in this way can be simulated individually or together. Finally, the simulation results of the simulated scenarios can be clearly displayed, analyzed and compared in the Output Viewer.
Graphical Modeling of shift models and calendars
Layer editor
Most of the facilities are not in operation around the clock, employees are divided in the morning, late or night shift and have breaks, weekends and vacation. Such times can be graphically defined in the layer editor of the Process Simulator and assigned to the simulation objects.


Powerful and convenient analysis of simulation results
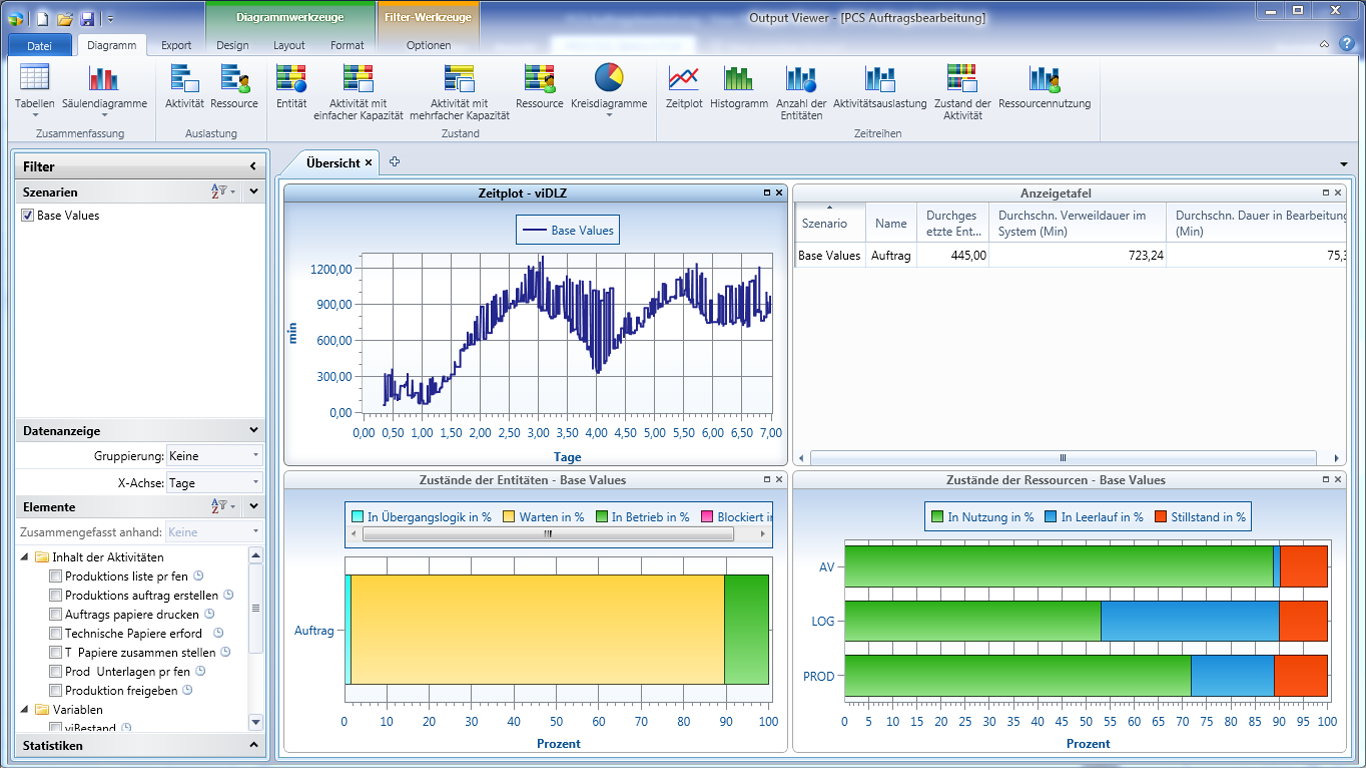
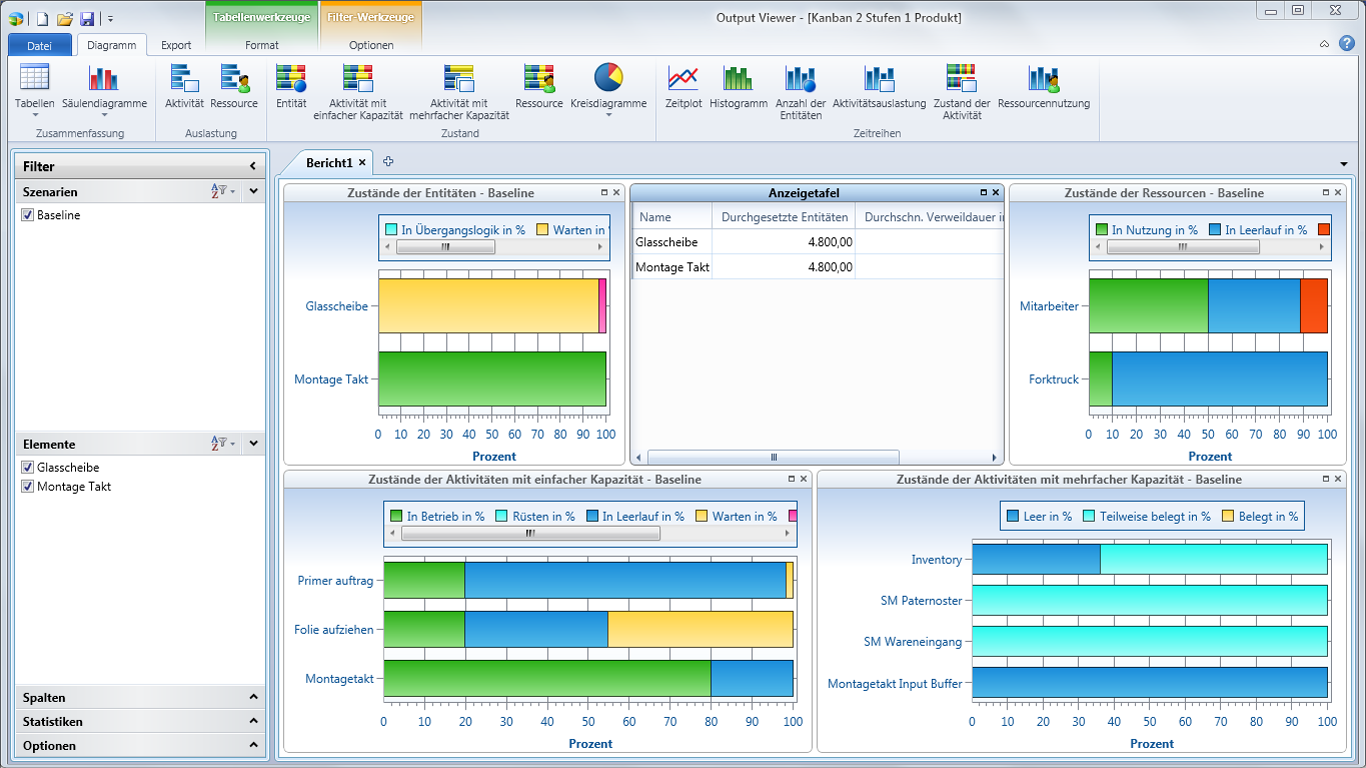
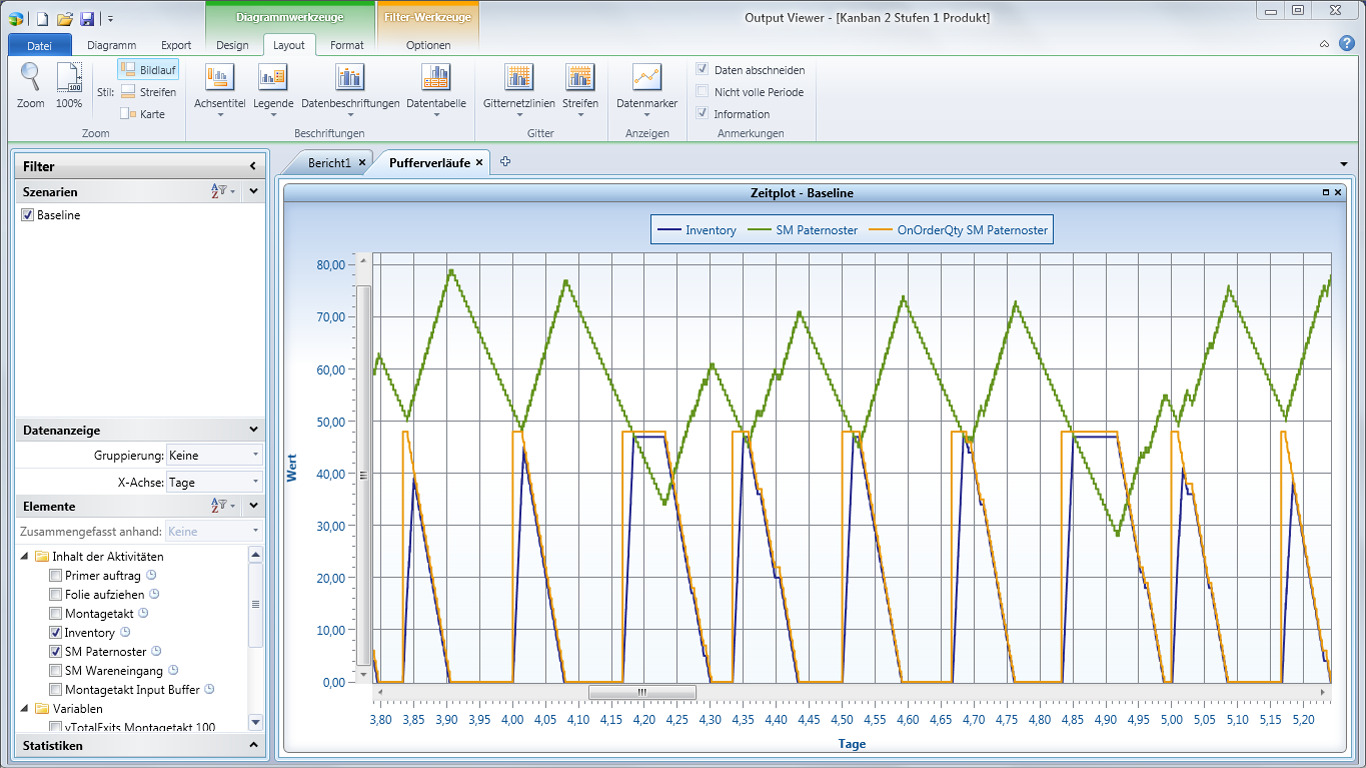
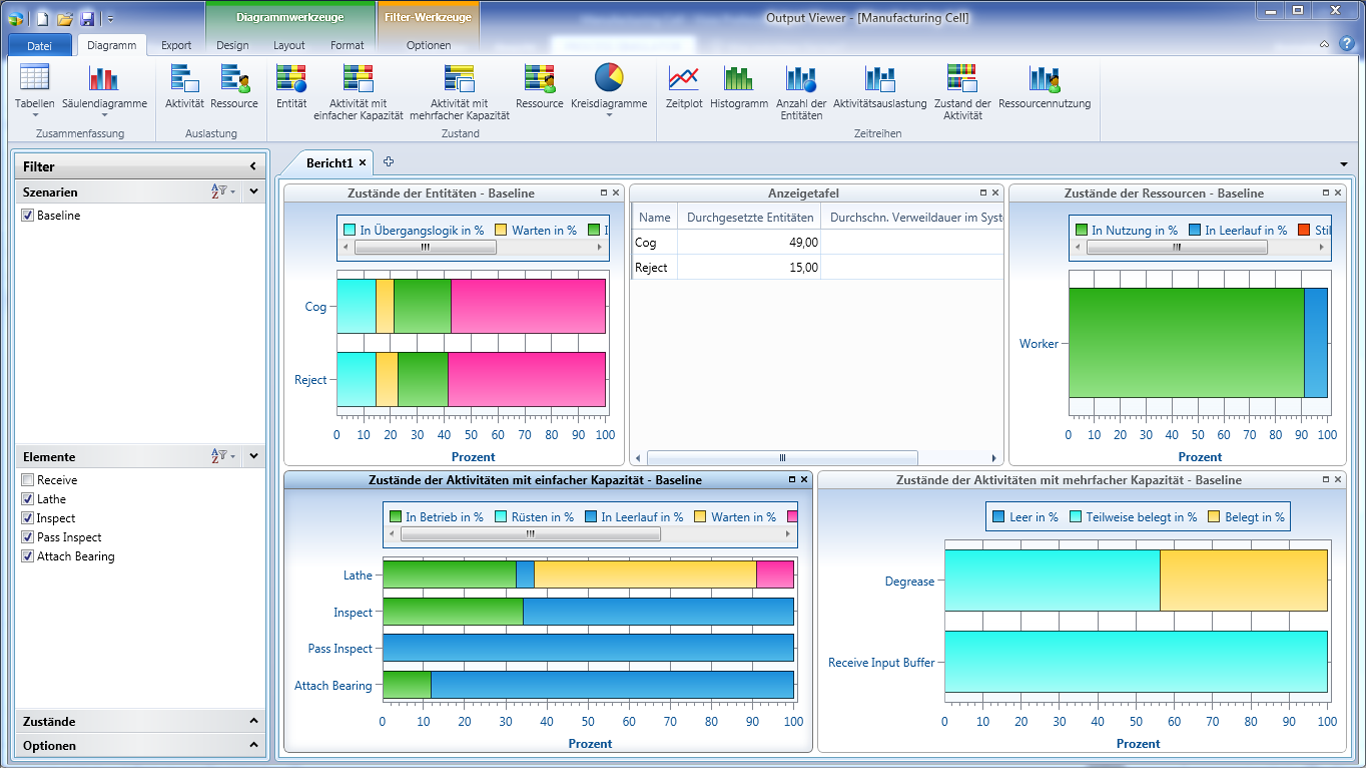
Output Viewer
With the Output Viewer associated with Process Simulator, you can conveniently analyze the result data, recorded during the simulation.
In addition to the standard reports, depending on the question, suitable display types (data tables, pie charts and bar charts, time plots, histograms, etc.) can be selected, configured and saved.
A highlight is the possibility to display evaluations of different simulation scenarios parallel to each other, so the results of different simulation runs (scenarios) can be directly compared with each other.
The reports are graphically appealing and can be used directly in presentations. Alternatively, you can, of course, export both the raw data and the generated charts to Excel.
Combining simulation and SixSigma analysis in Minitab
Interface to Minitab
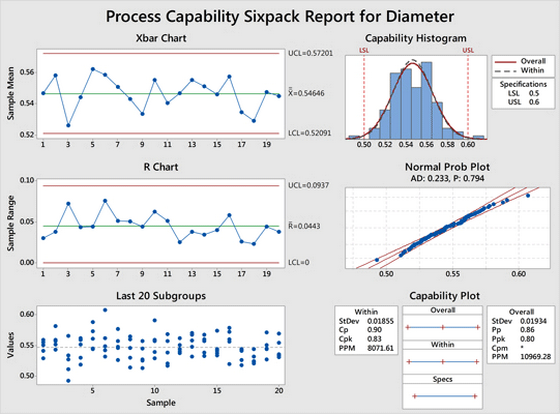
In addition to the analysis in the OutputViewer, the simulation results can also be analyzed in Minitab, which is an integral part of many SixSigma initiatives in companies and corporations.
You define the parameters to be analyzed in Process Simulator, such as Inventories, lead times, throughput or productivity. Process Simulator generates the data necessary for the analysis during the simulation and transfers the data to Minitab for analysis and presentation according to the SixSigma systematics.
Minitab is not included with Process Simulator.


Detailed analysis of resource usage over time
Interface to GBU-Gantt
With the help of GBU-Gantt, the time sequence and dependencies of processes - beyond the capabilities of the Output Viewer - can be clearly displayed and efficiently analyzed. On the Y-axis of the Gantt chart, the resources such as machines or employees are listed one below the other, and on the X-axis is the time stated. In each resource line, the executed processes can be displayed chronologically.
Each task has a start and end date, is assigned to a resource, and can have any number of attributes. Using these attributes, the processes can be colored, selected and analyzed.
Short simulation runtimes lead to optimal solutions and reliable results
Powerful Simulation Engine
Process Simulator features a powerful simulation engine compared to other manufacturers' simulation tools, and Process Simulator quickly simulates large simulation models with multi-year viewing times. Reducing the user's waiting time for a simulation run also gives the opportunity to perform numerous simulation runs on a research question. So he can, e.g. by systematically playing through numerous model parameterizations, find an optimum.
Even with the use of random distributions, it is necessary to perform numerous simulation runs - so-called replications - due to the statistical laws.
Only when simulating a sufficient number of replications it can be reliably determined how sensitive the target function is to chance and how strong the simulation results are.


Parameterize the randomness
Statistical distributions
Dynamics are often created because processes do not always last the same length of time, disruptions occur randomly, or customer orders are irregular. Such random processes can be parameterized in the Process Simulator by means of distributions and the resulting effects on the entire system can be analyzed.
For example, When the normal distribution Normal(6, 0.5) is used as the processing time, the Process Simulator determines the time used for each process according to the specified distribution.
If you have historical data about the process to be mapped, you can have the Stat::Fit module propose a suitable distribution function. In addition, Stat::Fit graphically displays all possible distributions depending on the selected parameters.